Flows in Datastripes
Flows are the core of Datastripes — they represent how data moves, changes, and becomes something insightful.
You’re not writing code. You’re designing a live process, visually.
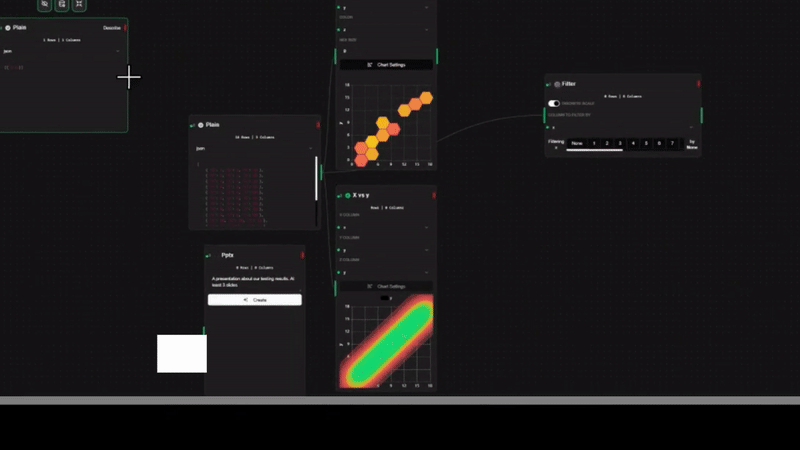
A Flow connects your sources to a series of nodes — each performing a task — and ends in outputs like dashboards or slideshows. It’s intuitive, interactive, and powerful.
What Exactly Is a Flow?
Think of it like a living blueprint for your data logic.
Data starts at one or more Sources, travels through Nodes (where things like filtering or calculations happen), and ends in Outputs — charts, tables, dashboards, slideshows, or even new data streams.
Flows update in real time. When your data changes — your outputs do too.
Building Your First Flow
Creating a flow is simple — and surprisingly fun.
Start from a blank canvas. Add a Source (like a SQL query or a live event feed). Then drag on Nodes to transform, filter, or visualize your data.
As you connect the nodes, you’re literally defining the flow of your logic.
Each Edge — the lines connecting your nodes — represents how the data travels. Linear or parallel, simple or branching — it’s all possible.
Click a node to configure it. Want to filter rows? Aggregate values? Just select what you need and go.
Nodes and Edges
Nodes are the workers in your flow. Each one handles a task: transform a dataset, create a chart, filter rows, join data, etc.
Edges are the pipes. They move data from one node to the next — either in sequence or branching out in parallel.
Need to compare two filtered versions of the same source? Just create two parallel paths.
What About Displacements?
Good question.
Displacements are how data changes between nodes. Sometimes you're just passing raw data through — other times you're filtering, aggregating, or reshaping it entirely.
In Datastripes, you control that behavior for every connection. That’s what makes flows expressive and precise.
Displacements give you control over how much and what type of data moves between steps — without needing custom scripts.
Building Blocks: The Mechanics
Once you’re inside the editor, here’s how it works:
- Drag and drop nodes onto the canvas
- Connect them to define flow direction
- Configure each node visually
- Watch the results update instantly
It’s designed to feel natural — like sketching ideas on a whiteboard, only the output is real, live, and shareable.
A Simple Flow in Action
Let’s walk through an example:
- You connect to a SQL database
- Add a Filter Node to exclude unwanted data
- Drop in a Chart Node to visualize a trend
- Attach it to a Dashboard Output
That’s it. You’ve built a working, live flow.
Flows are versioned. You can save, duplicate, or evolve them safely — perfect for iteration and collaboration.
Pro Tips for Powerful Flows
As you build more flows, here are a few suggestions:
Name Everything Clearly
A well-labeled node helps future-you (and your team) understand what’s going on at a glance.
Reuse and Duplicate
You can copy flows or sub-flows to try different approaches without losing work.
Don’t Be Afraid to Experiment
Try out unusual node combinations or branching strategies — Datastripes lets you explore without fear of breaking things.
Where to Next?
Flows are only the beginning — but they unlock everything else.
Want to dive deeper?
- Nodes Overview
- Dashboards
- Plugins
"A flow is a story your data tells."